
In my work teaching preservice and inservice teachers about the Next Generation Science Standards I like to think that I have a certain “expertise” about the Science and Engineering Practices. But last year I realized that I had been neglecting (and making some assumptions about) the practice of Analyzing and Interpreting Data. As I started to dig in and engaged in some online learning activities about Analyzing and Interpreting Data I soon realized that my understanding of this practice was pretty shallow and that I was lacking in innovative ways of considering the practice.
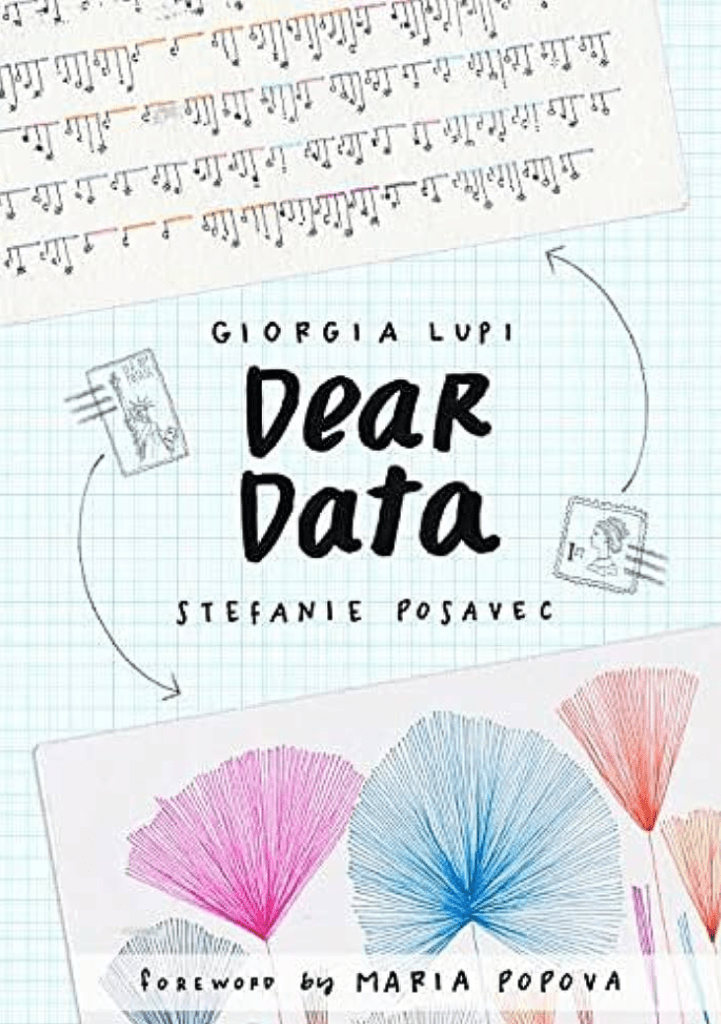
One resource that I found during my learning was the website (and book) Dear Data. I immediately fell in love with the idea of the project and I could feel myself being pushed outside my comfort zone. I was seeing how collecting and representing data could be personal, fun, creative, and artistic. I was in.
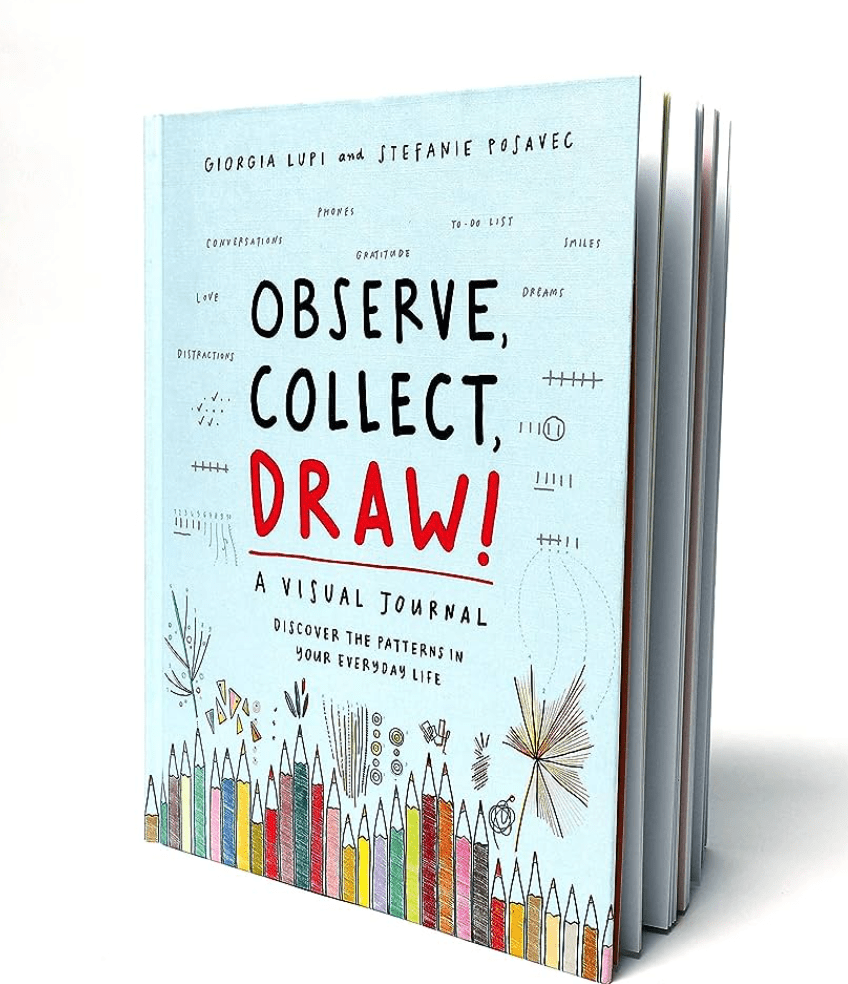
Dear Data stems from a year-long project that involved two women (Giorgia and Stephanie) who lived on different parts of the globe. They decided to collect everyday data and then to represent their weekly findings visually by designing hand-made postcards. The postcards were mailed each week and then collected to form the book Dear Data. The authors also recently released a very thoughtful interactive journal titled Observe, Collect, Draw: A Visual Journal. (The title of this journal doesn’t immediately make us think about data…but it is about data.) Giorgia and Stephanie began the project and their ritual eventually became a catalyst for a friendship. See the embedded video below of the authors discussing the Dear Data project.
I’m considering having my college students immerse themselves in this type of data collection and representation. How might you use these type of data stories with your students?
As an Amazon Associate I earn from qualifying purchases.


Leave a comment